History Chart
You can create a chart of past activity for Operations, Steps and Jobs. This provides a convenient way to see how your objects are processing over time making it easy to see run time variances, trends, etc.
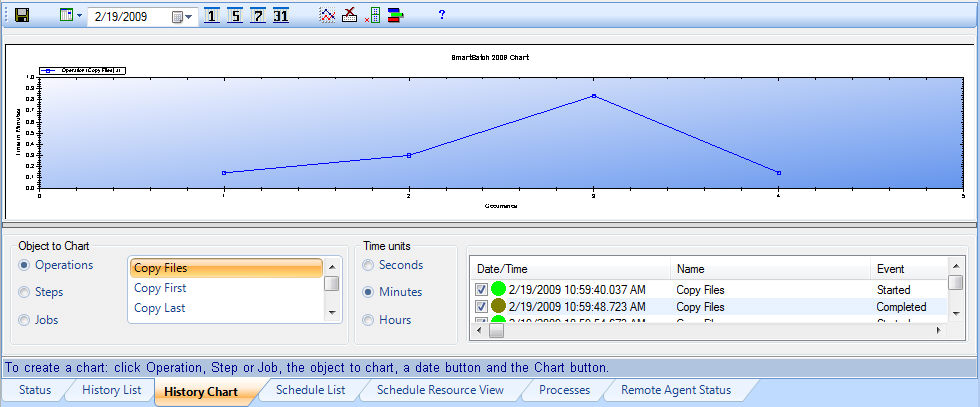
The following pictures shows an example of a History Chart. You can click on "hot spot" areas in the picture below to get detailed information about buttons, controls and fields.
Note: This History Chart view has two main parts that are separated. The top part shows the actual chart. The low part provides a way to select the object and history period to chart. The size of each part can be set by dragging and dropping this horizontal separator know as a splitter. If for some reason, the lower part of the view is not displayed, click on the Reset Window Size button in the toolbar. This will allocate an equal amount of window space to each part in the view. To determine which buttons to use you can get a text popup message providing a brief title of the buttons action by hovering the mouse over the button.
To Create a Chart:
Select the object type to chart in the lower view (Operation, Step or Job).
Select the object to chart.
Select a date to start with or click on one of the predefined date buttons (1, 5, 7 or 31).
Click on the Chart button in the toolbar.
To Chart another object:
Repeat the procedure above in "To Create a Chart".
To Reset the Chart
Click on the Reset button in the toolbar.